
Today we're announcing the availability of API latency metrics in the Authzed dashboard. Now Authzed users can see the performance of their API usage and more easily correlate performance of Authzed with their own applications.
Authzed is a database and service that stores, computes, and validates your application's permissions.
Developers create a schema that models their permissions requirements and use client libraries to apply the schema to the database, insert data into the database, and query the data to efficiently check permissions in their applications.
You can learn more by following our Protect Your First App guide or watching the video of us modeling GitHub's permission system.
Playing buzzword bingo
Observability is the focus of collecting telemetry such as metrics, logs, and execution traces in order to reduce the friction in understanding the internals of running software. In the past few years, there have been major strides to improve the observability of software in the cloud native ecosystem. The systems powering Authzed are no exception and follow these best practices. Observability data helps us run a stable and performant service for our users. This is where most SaaS products stop, but we think that the SaaS ecosystem can do better.
What about the users?
While following best practices internally is great for our team, it leaves our users in a position where they are forced to treat Authzed as an opaque, black-box system. To improve upon this situtation, communicating outages and maintenance via Status Pages and Twitter has now become commonplace in the industry of SaaS products. Many services, including Authzed, also have service-wide metrics that are made public on their status pages. But if some of this data is being made public, this begs the question: why keep observability data private at all?
Removing the veil
Moving forward, our plan is maintain a single observability stack for both internal and external usage. The only difference between these two use cases is that users will be only able to query for observability data for their own systems. Observability data will first make its way into the Authzed dashboard, but always with a design requirement that our users will eventually be able to directly query the data sources that power the dashboard.
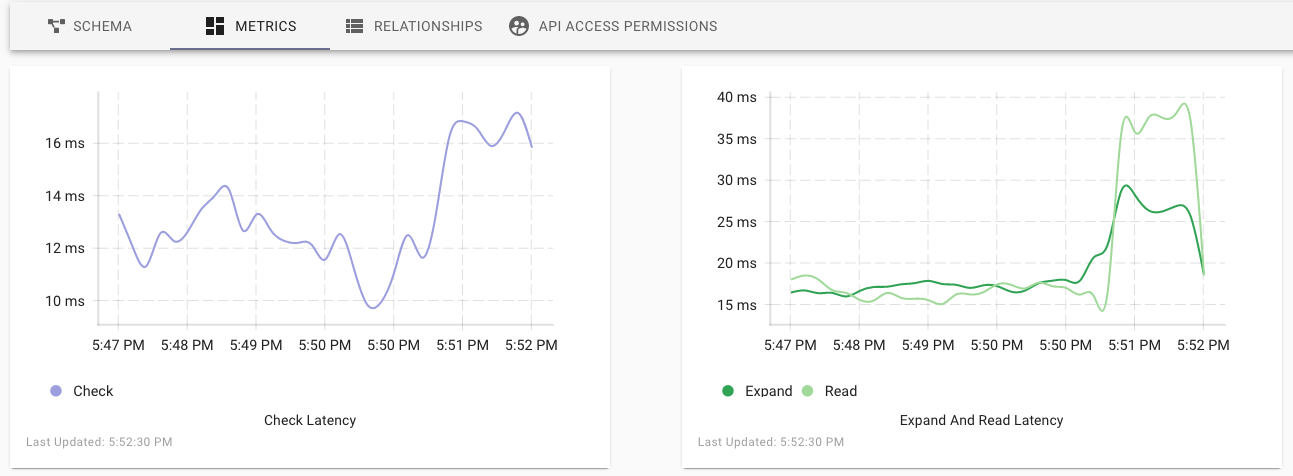
Because Authzed depends on having low latency communication with customer applications, it was obvious that we start by exposing performance metrics first. Users will now find a "Metrics" tab on their Permissions Systems that contains line graphs with the 95th percentile latency for the Check, Expand, Read, and Write API requests.
After sufficient testing, we plan to document the process for configuring your own observability stack to use our Prometheus data source for your own visualizations and alerting rules. For those looking for all the awesome technical details as to how we are securing and scaling out our observability stack: we will be covering that in a future blog post.
If tackling problems like these sounds exciting to you, consider checking out our careers page, as we're currently hiring for the full spectrum of engineering roles.
Additional Reading
If you’re interested in learning more about Authorization and Google Zanzibar, we recommend reading the following posts:
