
Today, AuthZed is providing additional observability capabilities to AuthZed's cloud products with the introduction of our official Datadog Integration. All critical infrastructure should be observable and authorization is no exception. Our integration with Datadog gives engineering teams instant insight into authorization performance, latency, and anomalies—without adding custom tooling or overhead.
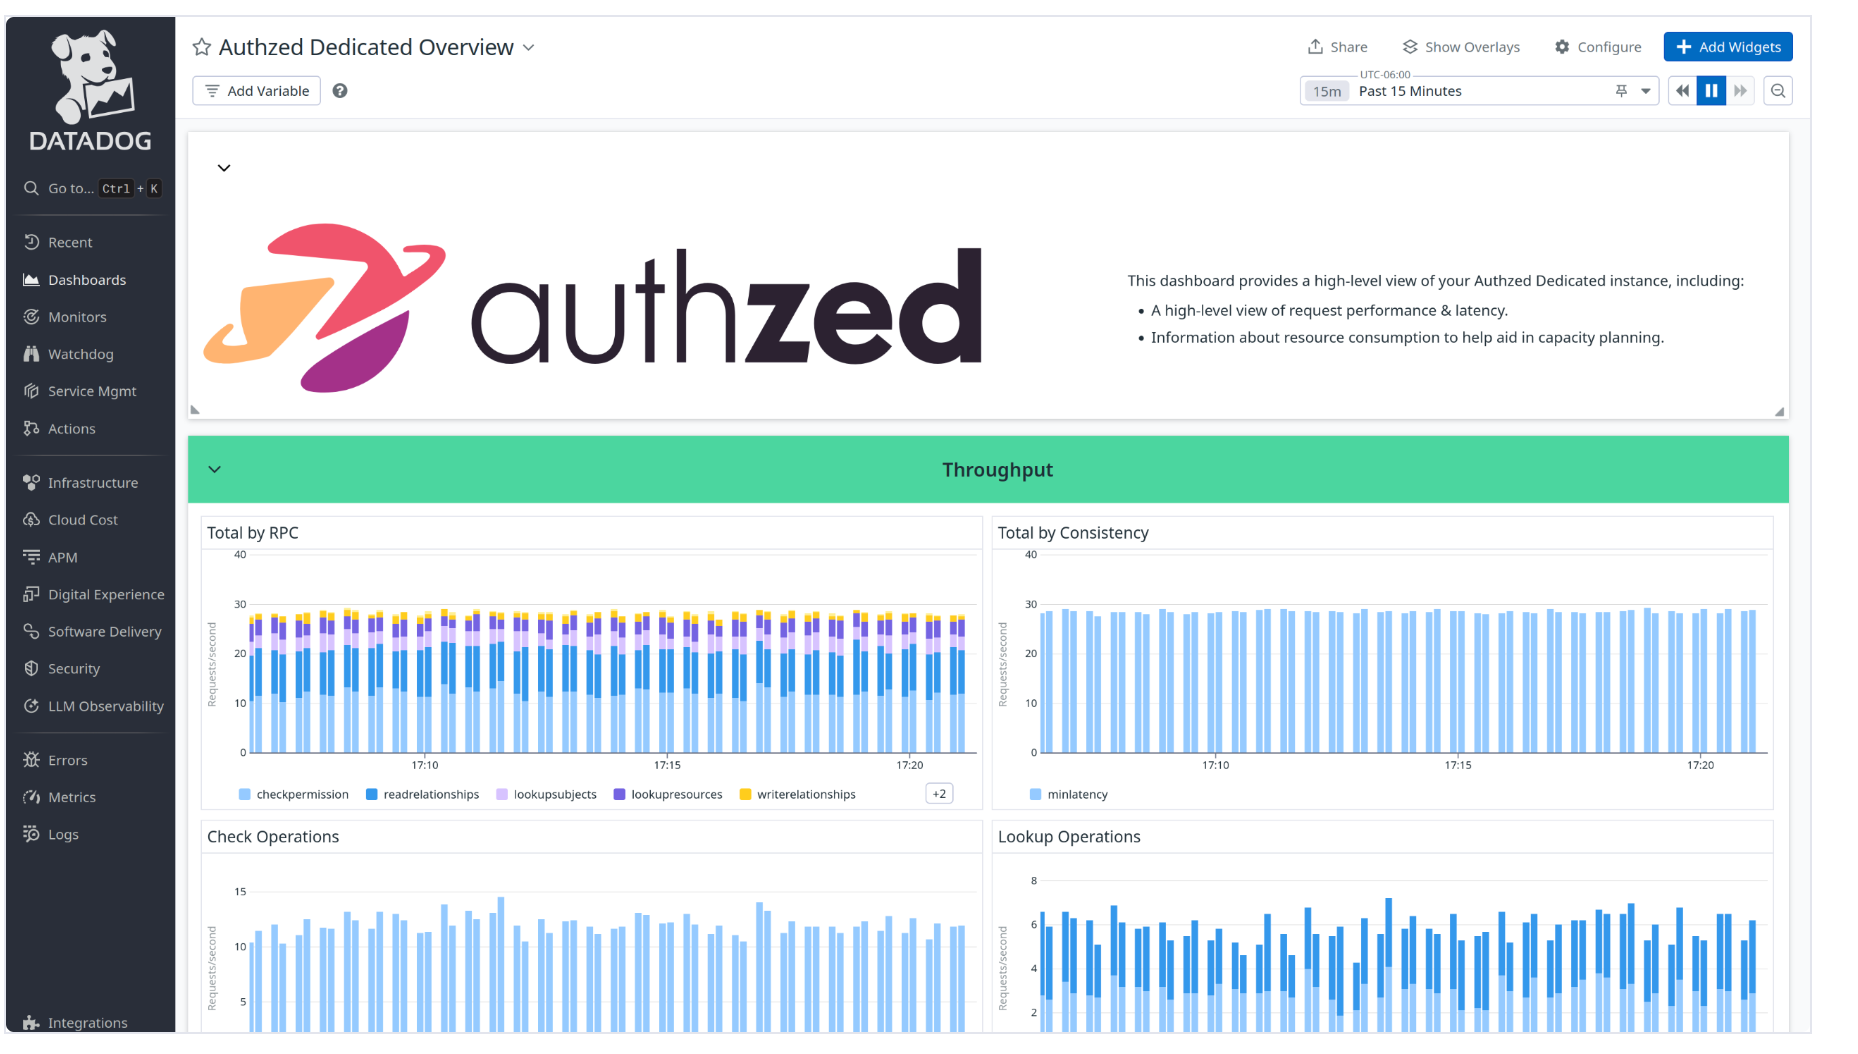
With this new integration, customers can now centralize that observability data with the rest of their data in Datadog—giving them the ability to correlate events across their entire platform. AuthZed's cloud products continue to include a web console with out-of-the-box dashboards containing metrics across the various infrastructure components that power a permissions system. At the same time, users of the Datadog integration will also have a mirror of these dashboards available in Datadog if they do not wish to create their own.
"Being able to visualize how AuthZed performs alongside our other systems gives us real peace of mind," said Eric Zaporzan, Director of Infrastructure, at Neo Financial. "Since we already use Datadog, it was simple to send AuthZed metrics there and gain a unified view of our entire stack."
AuthZed metrics allow developers and SREs to monitor their deployments, including request latency, cache metrics (such as size and hit/miss rates), and datastore connection and query performance. These metrics help diagnose performance issues and fine-tune the performance of their SpiceDB clusters.
Get Started Using Datadog with AuthZed in 7 Steps
The Datadog integration is available in the AuthZed Dashboard under the “Settings” tab on a Permission System.
- Go to the dashboard homepage.
- Select a Permission System for which to submit metrics.
- Click on the Settings tab.
- Scroll down to the Datadog Metrics block of the settings UI.
- Enter your Datadog account API key.
- Enter your Datadog site if different from the default.
- Click Save.
To ensure that the dashboard graph for latency correctly shows the p50, p95, and p99 latencies, you’ll also need to set the Percentiles setting for the authzed.grpc.server_handling metric in the Metrics Summary view to ON.
TADA 🎉 You should see metrics start to flow to Datadog shortly thereafter.
I want to thank all of the AuthZed engineers involved in shipping this feature, but especially Tanner Stirrat who shepherded this project from inception and I can't wait to see all the custom dashboards our customers make in the future!
Interested in learning more? Join our Office Hours on July 3rd here on YouTube.