
Predicting the latest OWASP Top 10 with CVE Data from 2022-2025
OWASP is set to release their first Top 10 update since 2021, and this year’s list is one of the most awaited because of the generational shift that is AI. The security landscape has fundamentally shifted thanks to AI being embedded in production systems across enterprises from RAG pipelines to autonomous agents. I thought it would be a fun little exercise to look at CVE data from 2022-2025 and make predictions on what the top 5 in the updates list would look like. Read on to find out what I found.
The OWASP Top 10 List
The OWASP Top 10 is a regularly updated list of the most critical security risks to web applications. It’s a go-to reference for organizations looking to prioritize their security efforts. We’ve always had a keen eye on this list as it’s our mission to fix broken access control.
The last 4 lists have been released in 2010, 2013, 2017 and 2021 with the next list scheduled for release soon, in Q3 2025.
The OWASP Foundation builds this list using a combination of large-scale vulnerability data, community surveys, and expert input. The goal is to create a snapshot of the most prevalent and impactful categories of web application risks. So I thought I’ll crunch some numbers from CVE data that is publicly available.
Methodology
This was not a scientific study — I’m not a data scientist, just an enthusiast in the cloud and security space. The aim here was to explore the data, learn more about how OWASP categories relate to CVEs and CWEs, and see if the trends point toward likely candidates for the upcoming list.
Here’s the process I followed to get some metrics around the most common CVEs:
-
Collect CVEs from 2022–2025
- I pulled data from the NVD (National Vulnerability Database) API. Yearly JSON feeds are available with data from all the CVEs
- Since the last list came out in 2021, I limited the dataset to CVEs with a published date between January 1, 2022 and July 31, 2025.
-
Map CWEs to OWASP Top 10 Categories
- Each CVE is linked to one or more CWE (Common Weakness Enumeration) entries. A CWE is a community-developed list of common software and hardware weaknesses.
- I used OWASP’s official CWE mapping (when available) to map the CWEs to entries in the OWASP list.
For example:
CWE-201 - ‘Insertion of Sensitive Information Into Sent Data’ maps to ‘Broken Access Control’.
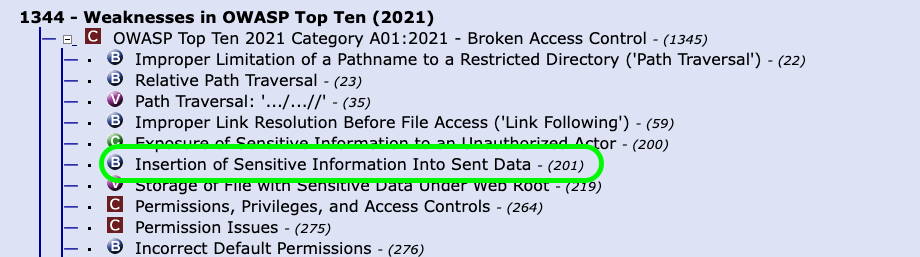
- I extracted all the CWE IDs from the dataset and mapped a list of CWE IDs (e.g., "CWE-201") to their corresponding OWASP categories
def map_cwe_to_owasp(cwe_ids):
   owasp_set = set()
   for cwe in cwe_ids:
       try:
           cwe_num = int(cwe.replace("CWE-", ""))
           if cwe_num in CWE_TO_OWASP:
               owasp_set.add(CWE_TO_OWASP[cwe_num])
       except ValueError:
           continue
   return list(owasp_set)
- Here’s the mapping I made for the Top 8 categories from the 2021 list (truncated for readability, the full code is in the repo)
CWE_TO_OWASP = {
   # A01: Broken Access Control
   22: "A01:2021 - Broken Access Control",
   23: "A01:2021 - Broken Access Control",
   # ...
   1275: "A01:2021 - Broken Access Control",


   # A02: Cryptographic Failures
   261: "A02:2021 - Cryptographic Failures",
   296: "A02:2021 - Cryptographic Failures"
   # ...,
   916: "A02:2021 - Cryptographic Failures",


   # A03: Injection
   20: "A03:2021 - Injection",
   74: "A03:2021 - Injection",
   # ...
   917: "A03:2021 - Injection",


   # A04 Insecure Design
   73: "A04:2021 - Insecure Design",
   183: "A04:2021 - Insecure Design",
   # ...
   1173: "A04:2021 - Insecure Design",


   # A05 Security Misconfiguration
   2: "A05:2021 - Security Misconfiguration",
   11: "A05:2021 - Security Misconfiguration",
   # ...
   1032: "A05:2021 - Security Misconfiguration",

   # A05 Security Misconfiguration
   937: "A06:2021 - Vulnerable and Outdated Components",
   # ...
   1104: "A06:2021 - Vulnerable and Outdated Components",


   # A07:2021 - Identification and Authentication Failures
   255: "A07:2021 - Identification and Authentication Failures",
   259: "A07:2021 - Identification and Authentication Failures",
   # ...
   1216: "A07:2021 - Identification and Authentication Failures",


   # A08:2021 - Software and Data Integrity Failures
   345: "A08:2021 - Software and Data Integrity Failures",
   353: "A08:2021 - Software and Data Integrity Failures",
   # ...
   915: "A08:2021 - Software and Data Integrity Failures",
- Map CVEs to CWEs
- The NVD 2.0 dataset embeds weaknesses under
cve.weaknesses[].description[].valuewith CWE IDs like CWE-201. I wrote a script to process the JSON containing NVD vulnerability data to extract CWE IDs for each CVE, and then map it to OWASP categories.
- The NVD 2.0 dataset embeds weaknesses under
def process_nvd_file(input_path, output_path):
   with open(input_path, "r") as f:
       data = json.load(f)


   results = []
   for entry in data["vulnerabilities"]:
       cve_id = entry.get("cve", {}).get("id", "UNKNOWN")
       cwe_ids = []


       # Extract CWE IDs from weaknesses
       for problem in entry.get("cve", {}).get("weaknesses", []):
           for desc in problem.get("description", []):
               cwe_id = desc.get("value")
               if cwe_id and cwe_id != "NVD-CWE-noinfo":
                   cwe_ids.append(cwe_id)


       mapped_owasp = map_cwe_to_owasp(cwe_ids)


       results.append({
           "cve_id": cve_id,
           "cwe_ids": cwe_ids,
           "owasp_categories": mapped_owasp
       })


   with open(output_path, "w") as f:
       json.dump(results, f, indent=2)


   print(f"Wrote {len(results)} CVE entries with OWASP mapping to {output_path}")
We now have a new JSON file with mapped outputs that has all the CVEs mapped to OWASP categories (if there’s a match). This is what it looks like:
{
    "cve_id": "CVE-2024-0185",
    "cwe_ids": [
      "CWE-434",
      "CWE-434"
    ],
    "owasp_categories": [
      "A04:2021 - Insecure Design"
    ]
  },
  {
    "cve_id": "CVE-2024-0186",
    "cwe_ids": [
      "CWE-640"
    ],
    "owasp_categories": [
      "A07:2021 - Identification and Authentication Failures"
    ]
  },
I ran this code snippet for each data set from 2022-2025 and had separate JSON files for each year.
- Analyze the Data
Now that we have this data of mapped outputs, we can run some data analysis to find the most common occurrences per year.
- I essentially counted the number of CVEs per OWASP category for each year.
for filename in os.listdir(DATA_DIR):

# Loads the JSON data from the file, which contains a list of CVE entries.

    year = filename.replace("mapped_output_", "").replace(".json", "")
    year_path = os.path.join(DATA_DIR, filename)

    with open(year_path, "r") as f:
        entries = json.load(f)

    for entry in entries:
        for category in entry.get("owasp_categories", []):
            yearly_data[year][category] += 1
- To get some visualizations around the data, I sorted and added graphs to see which categories were trending.
# Convert to a DataFrame
df = pd.DataFrame(yearly_data).fillna(0).astype(int).sort_index()
df = df.T.sort_index()  # years as rows

# Save summary
df.to_csv("owasp_counts_by_year.csv")
print("\nSaved summary to owasp_counts_by_year.csv")

# Also print
print("\n=== OWASP Category Counts by Year ===")
print(df.to_string())

# Plot OWASP trends over time
plt.figure(figsize=(12, 7))

for column in df.columns:
    plt.plot(df.index, df[column], marker='o', label=column)

plt.title("OWASP Top 10 Category Trends (2022–2025)")
plt.xlabel("Year")
plt.ylabel("Number of CVEs")
plt.xticks(rotation=45)
plt.legend(title="OWASP Category", bbox_to_anchor=(1.05, 1), loc='upper left')
plt.tight_layout()
plt.grid(True)
plt.show()
This is what it looked like:
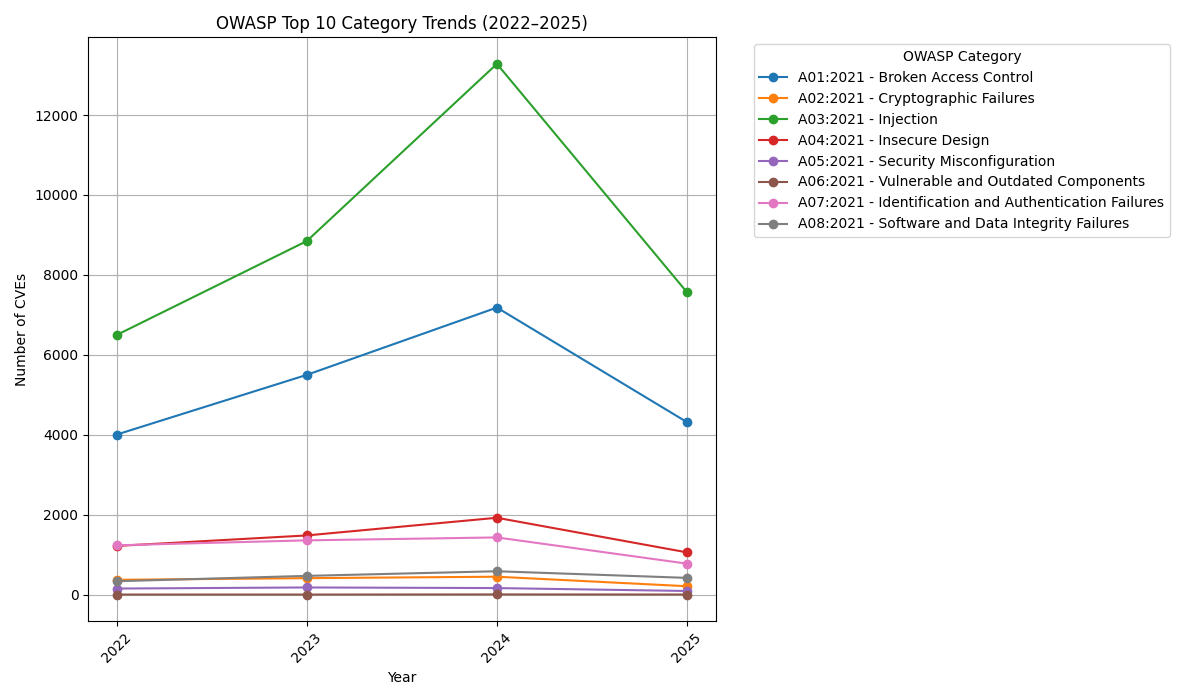
Here’s a table with all the data:
| A01: Broken Access Control | A02: Cryptographic Failures | A03: Injection | A04: Insecure Design | A05: Security Misconfiguration | A06: Vulnerable & Outdated Components | A07: Identification & Authentication Failures | A08: Software & Data Integrity Failures | |
|---|---|---|---|---|---|---|---|---|
| 2022 | 4004 | 370 | 6496 | 1217 | 151 | 1 | 1233 | 334 |
| 2023 | 5498 | 411 | 8846 | 1480 | 178 | 1 | 1357 | 468 |
| 2024 | 7182 | 447 | 13280 | 1922 | 163 | 4 | 1430 | 584 |
| 2025 | 4314 | 209 | 7563 | 1056 | 90 | 2 | 774 | 418 |
| Totals | 20998 | 1437 | 36185 | 5675 | 582 | 8 | 4794 | 1804 |
So looking at purely the number of incidences in CVEs, the Top 5 would look like this:
#5 Software and Data Integrity Failures
#4 Identification & Authentication Failures
#3 Insecure Design
#2 Broken Access Control
#1 Injection
But wait, OWASP’s methodology in compiling the list involves not just the frequency (how common) but the severity or impact of each weakness. Also, 2 out of the 10 in the list are chosen from a community survey among application security professionals, to compensate for the gaps in public data. In the past OWASP has also merged categories to form a new category. So based on that here’s my prediction for the Top 5
Prediction Time
There’s absolutely no doubt in my mind that the security implications of AI will have a big impact on the list. One point of note is that OWASP released a Top 10 list of LLM in November 2024. Whether they decided to keep the two lists separate or have overlap will largely determine the Top 10 this year.
So looking at the CVE data above (Broken Access Control and Injection had the most occurrences), and the rise of AI in production, here’s what I think will be the Top 5 in the OWASP list this year:
#5 Software and Data Integrity Failures
#4 Security Misconfigurations
#3 Insecure Design
#2 Injection
#1 Broken Access Control
With enterprises implementing AI Agents, RAG Pipelines and Model Context Protocol (MCP) in production, access control becomes a priority. Broken Access Control topped the list in 2021, and we’ve seen a slew of high profile data breaches recently so I think it will sit atop the list this year as well.
I asked Jake Moshenko, CEO of AuthZed about his Predictions for the list and while we agreed on the #1 position on the list, there were also a couple of things where we disagreed. Watch the video to find out what Jake thought the Top 5 would look like and which category he thinks might drop out of the Top 10 altogether.
Caveats
As I mentioned before, I’m not a data scientist so please feel free to improve upon this methodology in the Github Repo. I also need to state that:
- CVE data doesn’t represent all real-world vulnerabilities (e.g., business logic flaws are underreported). Also, vulnerabilities not related to web apps (eg: buffer overflow) were not considered.
- This approach only looks at vulnerability frequency, not impact or exploitability which are factors that OWASP also considers.
- OWASP’s real methodology includes community surveys, and telemetry from industry partners - which wasn’t part of this experiment.
Your Turn
What do you think the 2025 OWASP Top 10 will look like?
Do you agree with these trends, or do you think another category will spike?
I’d love to hear your thoughts in the comments on LinkedIn, BlueSky or Twitter
If you want to replicate this yourself, I’ve put the dataset links and code snippets on GitHub.