
Background
We've been working hard to make our managed AuthZed Dedicated offering capable of scaling as Google does—particularly since it’s in our messaging to prospects and customers as a core reason to choose AuthZed. One of those prospects challenged us to demonstrate our bold claims with a series of load tests that would culminate with 1 million requests per second against 100 billion relationships stored.
If you want to understand the performance of AuthZed Dedicated configured with CockroachDB for data storage or are interested in running your own scale tests, you will find our experience useful. I cover our setup and methodology below, along with the results. Spoiler: 👉 we got to 1 million requests per second, with 1% writes while maintaining 5.76ms P95 on CheckPermission. 🎉
Goals
The goals of the test were to validate that SpiceDB exhibits similar latency metrics across a total of 13 tests with varying throughput and relationships stored, here is the full list:
| Test | Relationships Stored | * Target QPS |
|---|---|---|
| T1 | 10,000,000 | 1,000 |
| T2 | 10,000,000 | 10,000 |
| T3 | 100,000,000 | 1,000 |
| T4 | 100,000,000 | 10,000 |
| T5 | 100,000,000 | 100,000 |
| T6 | 1,000,000,000 | 1,000 |
| T7 | 1,000,000,000 | 10,000 |
| T8 | 1,000,000,000 | 100,000 |
| T9 | 1,000,000,000 | 1,000,000 |
| T10 | 100,000,000,000 | 1,000 |
| T11 | 100,000,000,000 | 10,000 |
| T12 | 100,000,000,000 | 100,000 |
| T13 | 100,000,000,000 | 1,000,000 |
*Includes 1% WriteRelationship, remainder are CheckPermission
We had a couple of secondary goals as well:
- Collect various data points to understand and visualize the linear growth of computational resources with respect to traffic and dataset size.
- Identify how long it takes to upload data into a CockroachDB cluster. Many companies looking at a permissions database for authorization have existing data that needs migrating, and a crucial part of planning a rollout of a system like SpiceDB is understanding how long importing relationship data may take.
Test Infrastructure, Software, and Environment
For our tests, we used our AuthZed Dedicated product to deploy a SpiceDB Permissions System onto AWS, with CockroachDB as the backing datastore. AuthZed Dedicated leverages EKS to distribute pods across the available virtual machines. AuthZed Dedicated also isolates workloads onto distinct compute pools: one for our control plane, which runs supporting services like Envoy, Prometheus, Alert Manager, Grafana, etc, and another for SpiceDB itself. The earlier tests had Envoy, which manages load distribution within a SpiceDB cluster, running within each SpiceDB node, but we moved Envoy early on in our tests to its own pool within the control plane.
In AuthZed Dedicated, SpiceDB is deployed as a cluster of pod replicas with CPU and memory resource limits. We prevent SpiceDB Clusters from scheduling multiple pods (replicas) onto a single node with anti-affinity rules, and nodes are placed across availability zones to reduce the blast radius of a failure. Additionally, our Kubernetes clusters utilize CPU pinning—SpiceDB pods have dedicated CPU cores to maximize the time a core works within the same context.
We ended our tests with SpiceDB version 1.21.0, which included all of the improvements we implemented along the way (see: SpiceDB Improvements Along the Way). For CockroachDB, we leveraged CockroachDB Dedicated, with version v22.2.11. Optimizing CockroachDB connection management is covered in Maximizing CockroachDB Performance: Our Journey to 1 Million QPS.
To generate test data and test load, we wrote Go programs, which we detail below.
AWS Infrastructure
| Test | Relationships | QPS | Control Plane | QTY | SpiceDB | QTY |
|---|---|---|---|---|---|---|
| T1 | 10,000,000 | 1,000 | c6a.xlarge - 4 vCPU | 1 | c6a.xlarge - 4 vCPU | 3 |
| T2 | 10,000,000 | 10,000 | c6a.xlarge - 4 vCPU | 1 | c6a.2xlarge - 8 vCPU | 4 |
| T3 | 100,000,000 | 1,000 | c6a.xlarge - 4 vCPU | 1 | c6a.xlarge - 4 vCPU | 6 |
| T4 | 100,000,000 | 10,000 | c6a.xlarge - 4 vCPU | 1 | c6a.2xlarge - 8 vCPU | 4 |
| T5 | 100,000,000 | 100,000 | c6a.xlarge - 4 vCPU | 1 | c6a.4xlarge - 16 vCPU | 12 |
| T6 | 1,000,000,000 | 1,000 | c6a.xlarge - 4 vCPU | 1 | c6a.xlarge - 4 vCPU | 3 |
| T7 | 1,000,000,000 | 10,000 | c6a.xlarge - 4 vCPU | 2 | c6a.2xlarge - 8 vCPU | 3 |
| T8 | 1,000,000,000 | 100,000 | c6a.4xlarge - 16 vCPU | 5 | c6a.4xlarge - 16 vCPU | 7 |
| T9 | 1,000,000,000 | 1,000,000 | c6a.4xlarge - 16 vCPU | 36 | c6a.8xlarge - 32 vCPU | 25 |
| T10 | 100,000,000,000 | 1,000 | c6a.xlarge - 4 vCPU | 4 | c6a.xlarge - 4 vCPU | 3 |
| T11 | 100,000,000,000 | 10,000 | c6a.xlarge - 4 vCPU | 5 | c6a.2xlarge - 8 vCPU | 5 |
| T12 | 100,000,000,000 | 100,000 | c6a.2xlarge - 8 vCPU | 9 | c6a.4xlarge - 16 vCPU | 7 |
| T13 | 100,000,000,000 | 1,000,000 | c6a.4xlarge - 16 vCPU | 35 | c6a.8xlarge - 32 vCPU | 21 |
CockroachDB Infrastructure
| Test | Relationships | QPS | CockroachDB | Attached Storage | QTY |
|---|---|---|---|---|---|
| T1 | 10,000,000 | 1,000 | m6i.2xlarge - 8 vCPU | 75 GiB | 4 |
| T2 | 10,000,000 | 10,000 | m6i.4xlarge - 16 vCPU | 150 GiB | 3 |
| T3 | 100,000,000 | 1,000 | m6i.4xlarge - 16 vCPU | 150 GiB | 3 |
| T4 | 100,000,000 | 10,000 | m6i.4xlarge - 16 vCPU | 150 GiB | 3 |
| T5 | 100,000,000 | 100,000 | m6i.4xlarge - 16 vCPU | 150 GiB | 5 |
| T6 | 1,000,000,000 | 1,000 | m6i.xlarge - 4 vCPU | 150 GiB | 3 |
| T7 | 1,000,000,000 | 10,000 | m6i.2xlarge - 8 vCPU | 150 GiB | 3 |
| T8 | 1,000,000,000 | 100,000 | m6i.4xlarge - 16 vCPU | 150 GiB | 6 |
| T9 | 1,000,000,000 | 1,000,000 | m6i.8xlarge - 32 vCPU | 150 GiB | 12 |
| T10 | 100,000,000,000 | 1,000 | m6i.2xlarge - 8 vCPU | 2,363 GiB | 6 |
| T11 | 100,000,000,000 | 10,000 | m6i.2xlarge - 8 vCPU | 2,363 GiB | 6 |
| T12 | 100,000,000,000 | 100,000 | m6i.4xlarge - 16 vCPU | 2,363 GiB | 6 |
| T13 | 100,000,000,000 | 1,000,000 | m6i.8xlarge - 32 vCPU | 2,363 GiB | 6 |
SLO Targets
In addition to the target queries per second for each test, we defined success criteria. Each test was measured across a 10-minute period and needed to meet the following:
- CheckPermission P95 of less than 25ms
- WriteRelationship P95 of less than 100ms
- Both needed to maintain a success rate greater than or equal to 99.9%
We built a Grafana dashboard to capture all of the relevant metrics and manually ported them into a spreadsheet for each test. We also captured the value of various other relevant metrics to validate our assumptions on how SpiceDB behaves under load, e.g., we were able to visualize how the subproblem cache-hit rate exhibited asymptotic behavior with respect to the API QPS.
SpiceDB Schema and Anticipated Load
A key part of SpiceDB is the SpiceDB Schema—it defines how entities relate to each other and the permissions those relationships drive. A SpiceDB Schema’s design drives the load on a SpiceDB cluster and the infrastructure capacity needed to maintain target SLOs. The complexity is added in the form of sub-problems that SpiceDB calculates; the Check it Out-2 blog does an excellent job of describing sub-problems in SpiceDB.
Another consideration is your use of SpiceDB’s RPCs—our tests focused on CheckPermission and WriteRelationships from the PermissionsService. If your workload requires listing resources, you will introduce the use of LookupResources, which would impact utilization and require additional infrastructure.
All tests were conducted against a customer-provided SpiceDB Schema, which modeled permissions for a social networking platform. Similar to how you use ORM (object-relational mapping) in an object programming language to map an object to a relational database, the concepts end-users see in a client application, e.g., a web app, need to be described in the SpiceDB Schema in a way that better serves the authorization model targeted. Here is the authorization behavior captured in the SpiceDB Schema:
- Users can share public/private content
- Users can follow each other
- Users can block other users
- Users can have conversations associated with a piece of content
- Public content can be seen by any user, private content can only be seen by followers
As you can see, the schema had a healthy dose of unions, intersections, and exclusions, three levels of nesting (user, content, and content interaction), and usage of wildcards to gate visibility. Your SpiceDB Schema is likely different and introduces its own complexity, which will have an impact on infrastructure requirements. See the SpiceDB Schema reference for a full list of operators.
Generating Test Data
We were provided with the number of users, content published, and interactions on the content as a baseline from which we derived the total number of relationships expected for each relation. Here is the breakdown:
| Relationship | 1M | 100M | 1B | 100B |
|---|---|---|---|---|
| user#visibility@user:*#... | 2,604 | 260,436 | 2,604,364 | 260,436,395 |
| user#visibility@user#follower | 2,604 | 260,436 | 2,604,365 | 260,436,495 |
| user#self@user#... | 5,209 | 520,873 | 5,208,729 | 520,872,890 |
| user#follower@user#... | 52,083 | 5,208,329 | 52,083,292 | 5,208,329,201 |
| interaction#creator@user#... | 104,167 | 10,416,658 | 104,166,583 | 10,416,658,302 |
| interaction#parent@content#... | 104,167 | 10,416,658 | 104,166,583 | 10,416,658,302 |
| content#visibility@user:*#... | 180,989 | 18,098,892 | 180,988,918 | 18,098,891,756 |
| content#visibility@user#follower | 183,594 | 18,359,412 | 183,594,125 | 18,359,412,451 |
| content#owner@user#... | 364,583 | 36,458,304 | 364,583,042 | 36,458,304,207 |
However, these numbers by themselves don’t tell us how content and interactions on that content are distributed across the users, for instance:
- How many pieces of content does the average user publish?
- How many followers does the average user have?
- What about the number of interactions by content published?
Using Pareto Distribution to Shape the Graph
If you think of popular social networks like Instagram, YouTube, or Twitter, it's not unreasonable to expect that some users are more active than others; some even generate content hourly and have millions of followers. We decided to follow a Pareto distribution to model the activity on a social network (see: Origins of power-law degree distribution in the heterogeneity of human activity in social networks). Meaning 20% of the network’s users generate 80% of the activity, comments, etc.
Being a graph database, when testing SpiceDB it’s important to consider the shape of your data and its impact on querying and performance. For example, some users in the graph may have very wide relations (think thousands of relationships), which would require a lot of subproblem dispatching. Very nested group membership can also be expensive to compute (and that’s the reason Zanzibar includes a component named Leopard Index to handle this efficiently).
We wrote a dataset generator in Go that took the number of users, pieces of content, and interactions as input, created relationships using a Pareto distribution, and outputted an Apache Avro file with the relationships represented in SQL, all compressed using Snappy. The file was stored in S3 and transferred into the target CockroachDB cluster. We ran the program to generate each dataset: 10M, 100M, 1B, and 100B.
This process kick-started our work to support bulk migration natively in the SpiceDB API. From version 1.22, SpiceDB exposes bulk_import and bulk_export RPCs that massively accelerate an initial import.
Generating Load
The workload was generated by defining a script with our in-house thumper tool. Thumper is a domain-specific load-test tool written in Go that takes a YAML file as input. The YAML file describes the sequence of steps to execute at a specified weight to emulate the API usage patterns of your applications. We’re exploring open sourcing Thumper—please upvote if you’d like to see this.
For CheckPermission, we were provided with the following distribution:
- 60% of requests check if the user can see a piece of content
- 30% of requests check if the user can see another user's profile
- 10% of requests check if the user can see an interaction
We also added 1% of write requests to the above distribution. 1% is more than the 0.19% Google’s Zanzibar paper documented as peak writes, but a lot of their usage comes from Read requests, suggesting Zanzibar is doing more than just authorization at Google.
The load-test script issued CheckPermission with consistency of minimize_latency, and the quantization window remained at the default 5 seconds, with a max staleness of 100% (another 5s seconds of potential staleness). If you want to know more about SpiceDB caching strategies, check out Jake's blog post Hotspot Caching in Google Zanzibar and SpiceDB. Jake’s post was inspired by one of the few performance bottlenecks we fixed as we started cranking up the QPS knob to some serious numbers.
Modeling DAUs
The numbers above by themselves are insufficient as well, e.g., which users, content, and interactions would actually make the requests? To model a real-world scenario we created synthetic Daily Active Users (DAUs) with a sampling factor. The sampling factor instructed the load-test generator to loop over a uniformly distributed sample of the user pool. For example, if we had 1,000 users and a sampling factor of 1%, the tool creates a pool of users with IDs 0, 100, 200... until user 1000, and then randomly samples from this pool of users.
The sampling factor is a key setting in a load test, as it has a direct impact on the volume of relationships SpiceDB needs to load from the datastore, and informs the compute required to withstand a specific workload. After all, Zanzibar has a strong focus on minimizing database access as much as possible, and many of its core design choices are at the service of sparing every last bit of database capacity.
Results
We succeeded at not only scaling to 1M QPS and 100B relationships but achieved consistent performance across all tests. 🎉 Along the way we identified and implemented performance improvements to SpiceDB (detailed in SpiceDB Improvements Along the Way. Somethings to keep in mind with our results:
- T1 through T5 had Envoy running on each SpiceDB node, we moved Envoy into an isolated control plane node pool after T5.
- T9 introduced crossfade revisions (PR #1285), which significantly improved performance.
- Tests T10 through T13 were conducted using version 1.21.0, which incorporated all of the performance improvements we uncovered in the tests before it.
Earlier tests were not revisited as we improved SpiceDB and AuthZed Dedicated since the updates were implemented to achieve the scale in our final test of 1M QPS and 100B relationships stored.
1,000 QPS
CheckPermission Latency
| Test | Relationships | Cache Hit | P95 Check Latency | P50 Check Latency |
|---|---|---|---|---|
| T1 | 10,000,000 | 33.20% | 19.7 | 5.39 |
| T3 | 100,000,000 | 5.00% | 23.2 | 7.03 |
| T6 | 1,000,000,000 | 21.60% | 18 | 6 |
| T10 | 100,000,000,000 | 0.00% | 17.1 | 8.05 |
WriteRelationship Latency
| Test | Relationships | Cache Hit | P95 Write Latency | P50 Write Latency |
|---|---|---|---|---|
| T1 | 10,000,000 | 33.20% | 30 | 14.50 |
| T3 | 100,000,000 | 5.00% | 20.9 | 13.00 |
| T6 | 1,000,000,000 | 21.60% | 53 | 16.80 |
| T10 | 100,000,000,000 | 0.00% | 17.9 | 12.90 |
10,000 QPS
CheckPermission Latency
| Test | Relationships | Cache Hit | P95 Check Latency | P50 Check Latency |
|---|---|---|---|---|
| T2 | 10,000,000 | 72.40% | 16.3 | 3.49 |
| T4 | 100,000,000 | 72.40% | 14.8 | 3.43 |
| T7 | 1,000,000,000 | 73.70% | 8.67 | 3.28 |
| T11 | 100,000,000,000 | 65.10% | 10 | 3.44 |
WriteRelationship Latency
| Test | Relationships | Cache Hit | P95 Write Latency | P50 Write Latency |
|---|---|---|---|---|
| T2 | 10,000,000 | 72.40% | 22.8 | 13.20 |
| T4 | 100,000,000 | 72.40% | 22.8 | 12.10 |
| T7 | 1,000,000,000 | 73.70% | 32.9 | 13.80 |
| T11 | 100,000,000,000 | 65.10% | 37 | 14.30 |
100,000 QPS
CheckPermission Latency
| Test | Relationships | Cache Hit | P95 Check Latency | P50 Check Latency |
|---|---|---|---|---|
| T5 | 100,000,000 | 87.60% | 11 | 3.21 |
| T8 | 1,000,000,000 | 89.30% | 5.93 | 3.12 |
| T12 | 100,000,000,000 | 89.20% | 5.86 | 3.08 |
WriteRelationship Latency
| Test | Relationships | Cache Hit | P95 Write Latency | P50 Write Latency |
|---|---|---|---|---|
| T5 | 100,000,000 | 87.60% | 56.6 | 17.70 |
| T8 | 1,000,000,000 | 89.30% | 42 | 15.60 |
| T12 | 100,000,000,000 | 89.20% | 49.3 | 14.90 |
1,000,000 QPS
CheckPermission Latency
| Test | Relationships | Cache Hit | P95 Check Latency | P50 Check Latency |
|---|---|---|---|---|
| T9 | 1,000,000,000 | 95.70% | 5.89 | 3.1 |
| T13 | 100,000,000,000 | 95.90% | 5.76 | 3.03 |
WriteRelationship Latency
| Test | Relationships | Cache Hit | P95 Write Latency | P50 Write Latency |
|---|---|---|---|---|
| T9 | 1,000,000,000 | 95.70% | 74.1 | 16.10 |
| T13 | 100,000,000,000 | 95.90% | 48.3 | 15.80 |
We also collected data on how long it takes to import a large amount of relationships into CockroachDB—which seems very reasonable. The largest import of 100B relationships took just over 5 days, but we think this can be lowered by making sure the dataset is split evenly across smaller files. The import was achieved using the AVRO file format and Snappy compression.
| Relationships | *Total Bytes per Relationship | **Total Relationship Storage | Import Time |
|---|---|---|---|
| 10,000,000 | 15 | 0.39 GiB | 45s |
| 100,000,000 | 29 | 7.85 GiB | 6m 20s |
| 1,000,000,000 | 42 | 116.48 GiB | 2h 40m |
| 100,000,000,000 | 29 | 7,948.15 GIB | 121h 24m |
* Includes 3x replication factor, * Doesn’t include other CockroachDB system related storage*
The graph below shows P95 CheckPermission and WriteRelationship latency, along with the observed Sub-Problem Cache Hit ratio, observed in the 4 tests conducted against 100B relationships stored: 1K, 10K, 100K, and 1M QPS.
SpiceDB Improvements Along the Way
While working through the tests, we uncovered areas for improvement and implemented them as we proceeded. The list of improvements are:
- CockroachDB connection balancing and pruning to reduce connection establishment overhead and better balance load across CockroachDB nodes (see Maximizing CockroachDB Performance: Our Journey to 1 Million QPS)
- Quantization windows smearing to prevent connection-pool acquisition thundering herds at the end of a quantization window (see Hotspot Caching in Google Zanzibar and SpiceDB)
- Fix to the hashring getting recomputed any time a sub-connection transitioned from ready to idle and vice-versa, which happened very frequently - PR #1310
- Better balancing of dispatch operations in the cluster by increasing the replication factor, which meant all nodes received an equal amount of dispatch calls
- Use static-CPU management in Kubernetes nodes
Additional Findings
- Generating 100B relationships took 24 hours on a single thread.
- Generated AVRO files were 700GB.
- Once imported and indexed, our largest dataset of 100B relationships used a total of 8TB (this includes a replication factor of 3).
- ⭐ We reran T13 (not captured in the data above) with Amazon’s ARM Graviton-based EC2 instances and observed 20% more throughput.
Lessons Learned
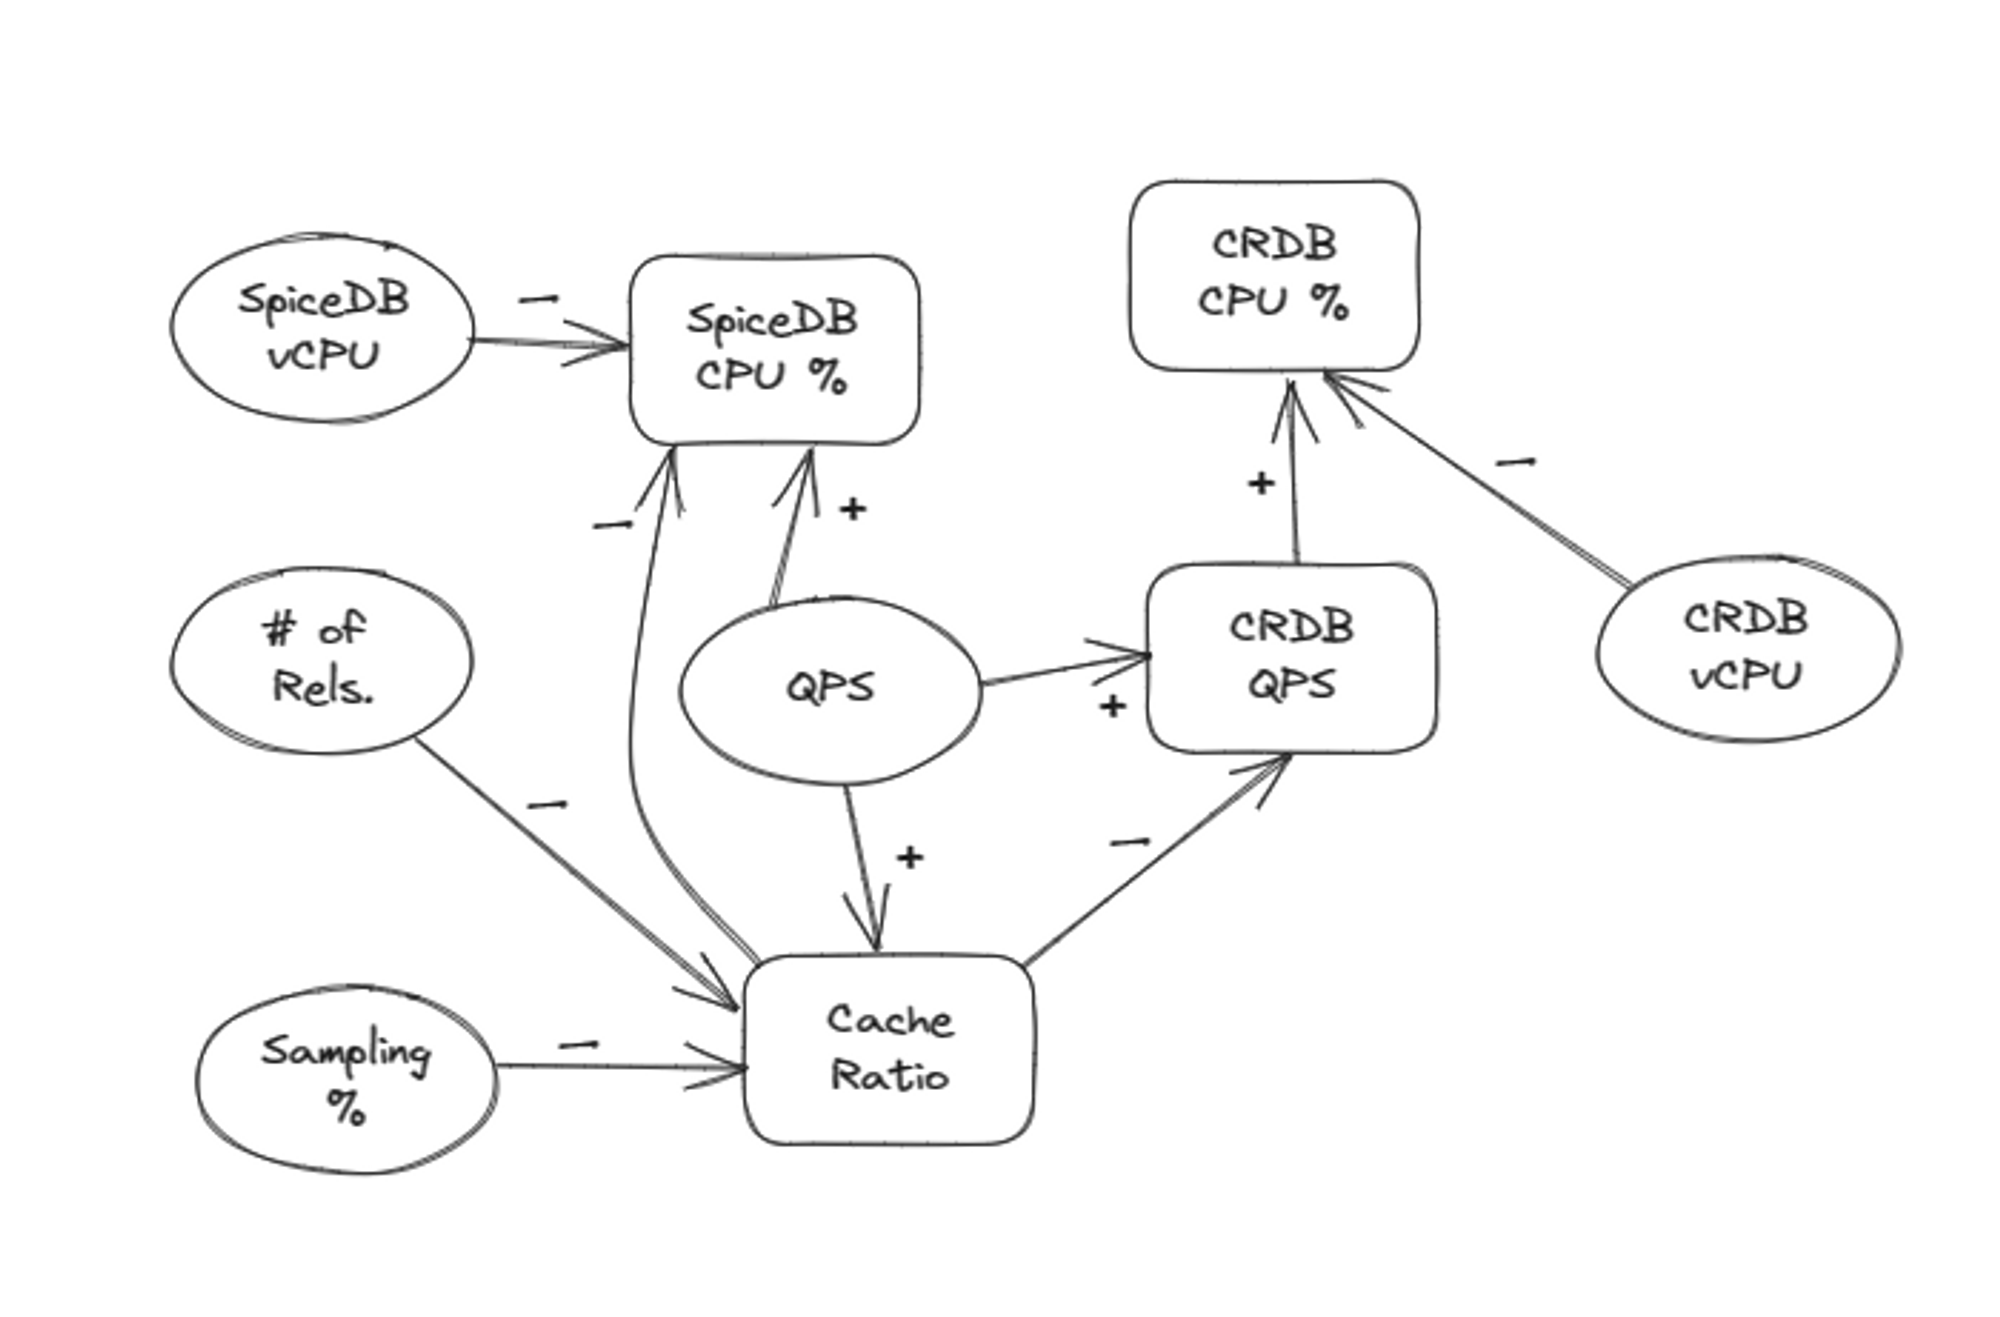
A key thing to note is the interdependency between variables in the test and their impact on each other, e.g., an increase in the cache ratio decreases SpiceDB’s CPU % and CockroachDB’s QPS. Here is a partial causal loop diagram depicting the behavior we witnessed during the tests:
We also learned a lot about planning and executing large-scale load tests against CockroachDB. Here are some of our learnings:
- If you are importing from S3 into CockroachDB, make sure the estimated import time does not exceed the expiration of an S3 pre-signed URL.
- Disable incremental backups for the load test, as the first backup could take abnormally long and ruin the load-test session.
- A CockroachDB Dedicated cluster can be scaled down to save costs while tests are not running. The duration is proportional to the number of nodes, as they have to be drained one by one and spun back up.
- Scaling in or out a cluster with this amount of data can take significant time and balloon costs, as data needs to be replicated and shards get rebalanced.
- You may need to get granular with your metrics to discover issues, e.g., we didn’t notice spikes in connection acquisition until we instructed Prometheus to scrape at 1-second intervals instead of the 30-second we were using.
- Default Spot-Instance limits can be easily hit at this scale, and with high machine count and market volatility, you may lose those savings if a test needs to be restarted.
If you have any questions about the test - don’t hesitate to reach out on our Discord! I’m @vroldanbet.
Additional Reading
- Understanding Google Zanzibar: A Comprehensive Overview
- Google's Zanzibar White Paper, Annotated by AuthZed
- Hotspot Caching in Google Zanzibar and SpiceDB
- Maximizing CockroachDB Performance: Our Journey to 1 Million QPS
- Check it Out-2: Breaking Into Subproblems
- AuthZed Dedicated
- A Primer on Modern Enterprise Authorization (AuthZ) Systems
- Fine-Grained Access Control: Can You Go Too Fine?
- Relationship Based Access Control (ReBAC): Using Graphs to Power your Authorization System
- Pitfalls of JWT Authorization